
Gantt Chart
complete
sameer
John at Taskade: I have few suggestions for Gantt Charts.
A. Ability to get a 'birds eye view' in Gantt Charts.
Usually at the start of a project spanning say 2 years, we need to view only various stages of the project. So we need to view entire month at a glance (as opposed to each day) and the entire chart needs to be printed on A3 or A4 paper - landscape mode - and text should be legible. This makes it easy for understanding and filing. [In Taskade, each stage can be denoted by a block]
B. Ability to add individual tasks within each stage.
Once the overview is approved, we need to add / edit / delete various tasks and sub tasks to each stage
C. Ability to print only a partial Gantt Chart - say one month only, or one stage only. This will allow us to have a clean and legible print on A4 paper - easy for filing and discussions in meetings.
D. Ability to make a Gantt Chart presentable.
Taskade is an incredibly visually appealing app. Gantt Chart colors, text etc should be customizable to make it visually appealing. Please refer https://www.gantt.io/
Their motto is 'create beautiful Gantt charts'
E. Ability to denote progress of a task in percentage.
This is really performace tracking. Say a task spans 5 days. On day 3 we should be able to view how far it has progressed. So a progress bar overlayed on the Gantt chart bar, with dragging ability will help incredibly.
So suppose I send a pdf of Gantt chart to client, he will get a overview of the project (few months down the road), detailed view by month or for each stage and status of current stage.
I hope you find this useful. Thank you.

John at Taskade
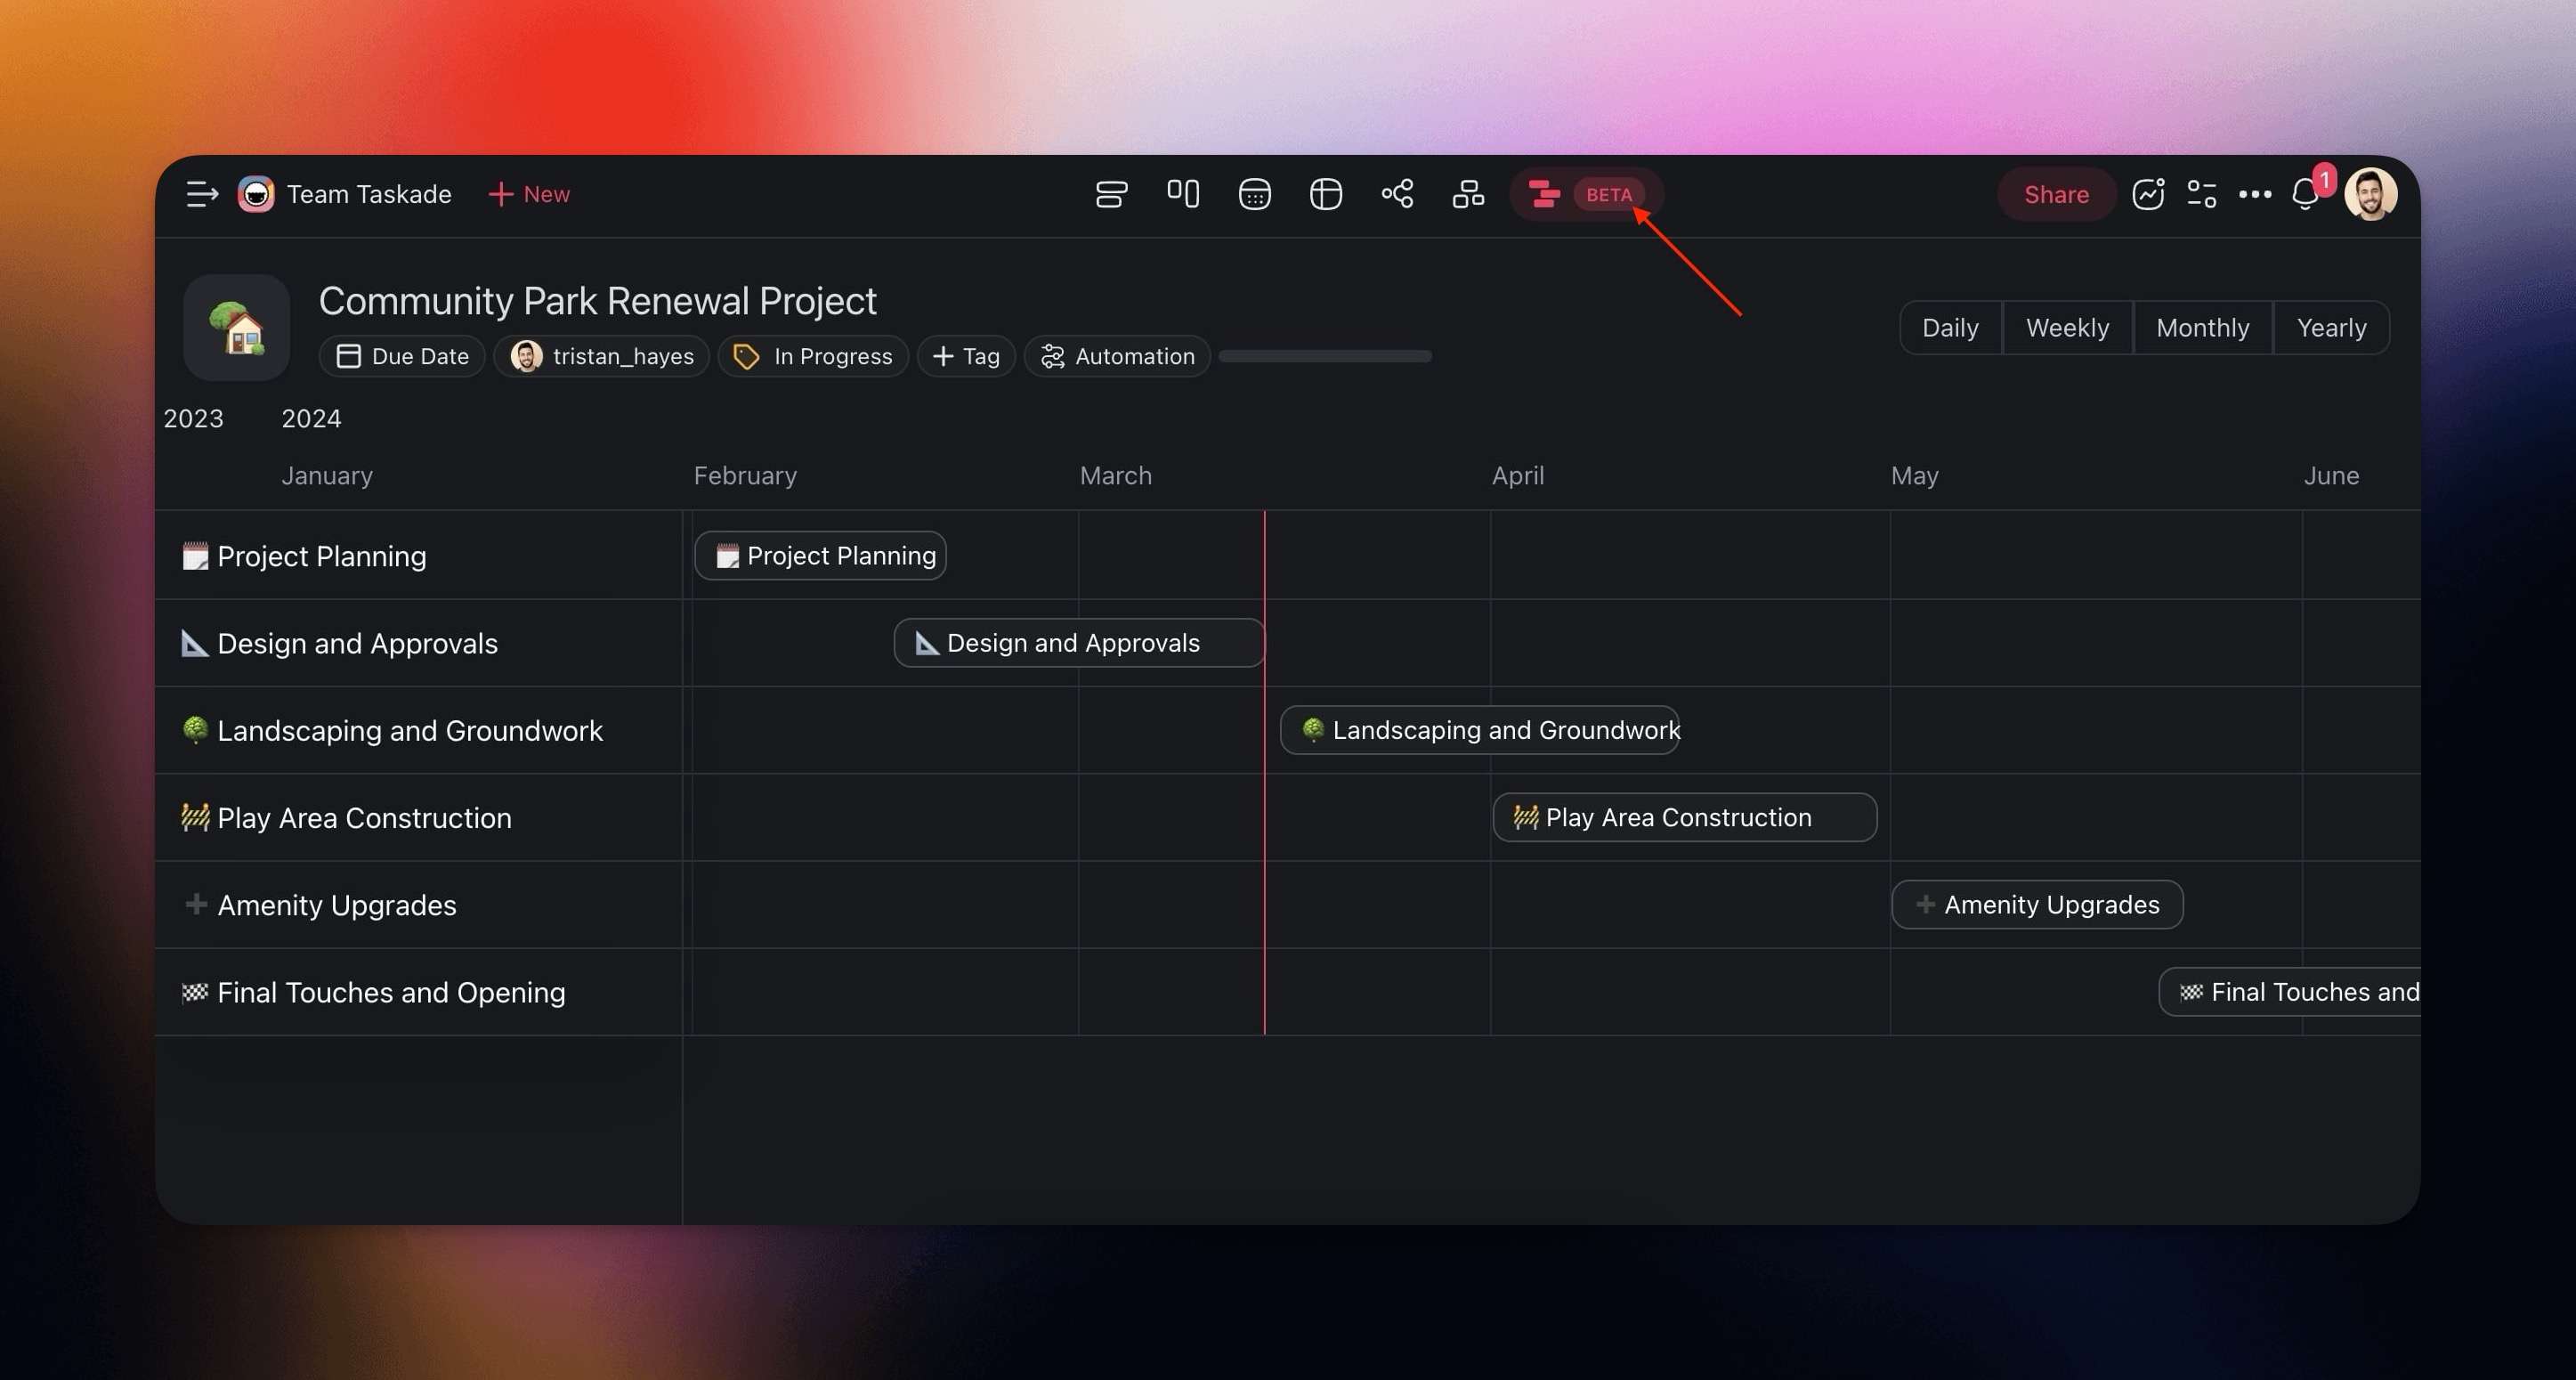
Daniel Jackman sameer Great news! Taskade's Gantt Chart View is ready for beta testing! This new feature lets you smoothly move from Mind Map to Table to Gantt. Dive in and help us refine it. Your insights are invaluable!
John at Taskade
complete
Hello everyone!
We're excited to announce that Taskade's new Gantt Chart View is now ready for beta testing! This feature allows you to smoothly transition from Mind Map to Table to Gantt, elevating your project planning experience. You're invited to beta test this dynamic new feature and provide your valuable feedback.
Get a sneak peek and learn more here: https://help.taskade.com/en/articles/9072639-gantt-chart-view.
We look forward to hearing your thoughts as we continue to enhance how you manage projects with Taskade!
Best,
The Taskade Team

John at Taskade
in progress
Gantt Chart / Timeline View are making their way to @Taskade! 🚀 Visualize your projects like never before. Here is a sneak peek. 👀
For all planners and project managers out there, stay tuned. And don't miss the Dark Mode reveal at the end of our video. 🌙

georgia.king
John at Taskade: Awesome! Can you make the bars fill with the colors, instead of only having little colored dots at the front of the text labels? Because I can barely see the bars right now.
If I use this for resource allocations, for example, I would need to be able to see this visualization at a glance and immediately know if someone on my team needs work vs. being booked for a month.
fairtale
John at Taskade hi John, what I'm looking for in a GANT chart is to be able to assing effort (in days) to tasks, and have it automatically arrange the tasks in a calendar view like this.
So for example:
Task-A | 3 days
Task-B | 2 days
Task-C | 5 days
Total | 10 days
However, in the gant you are showing here, all tasks seem to have the same size, and I have to do all the arranjing manually. The problem with this approach is that, each time a task is delayed by, for example, 2 days, then I will have to re-arrange all future tasks by those 2 days, which is a huge pain in the @ss and makes GANT charts too bureaucratic.
It would be really great if it could be tweaked a bit to avoid these issues:
- In the "action view" add a column called "days" to allow users to input expected work-time for the task.
- Size tasks in the GANT view according to the expected days.
- And use the days info to automatically arrange the tasks in the GANT view. Optionally add a button to disable the automatic sorting, to allow the user to sort tasks himself.
- Automatically set the due date based on the expected days and assigned user.
- For taks that aren't assigned to anyone, count the days as if assigned to an "annonymous" user.
I know I'm asking for a lot here, but these are the issues users deal with that make the whole experience a pain, and it would be pretty amazing if Taskade could solve this once and for all.
neekubee
John at Taskade waitinngggg
Narek Zograbian
fairtale Hmmm. It sounds like you're looking for more a workload/resource allocation tool with some overlapping features with Gantt view. Did I get right?
fairtale
Narek Zograbian yes! I want to assign tasks an effort/duration (days), and then assign the task to the user. And automatically this should add the task to the GANT flow.
I dont want to have to create all the tasks, and then go to GANT and have to manually select the days and times.
Especially since, if a task is delayed, I'll have to reorganize the whole GANT chart, moving every task into the future.
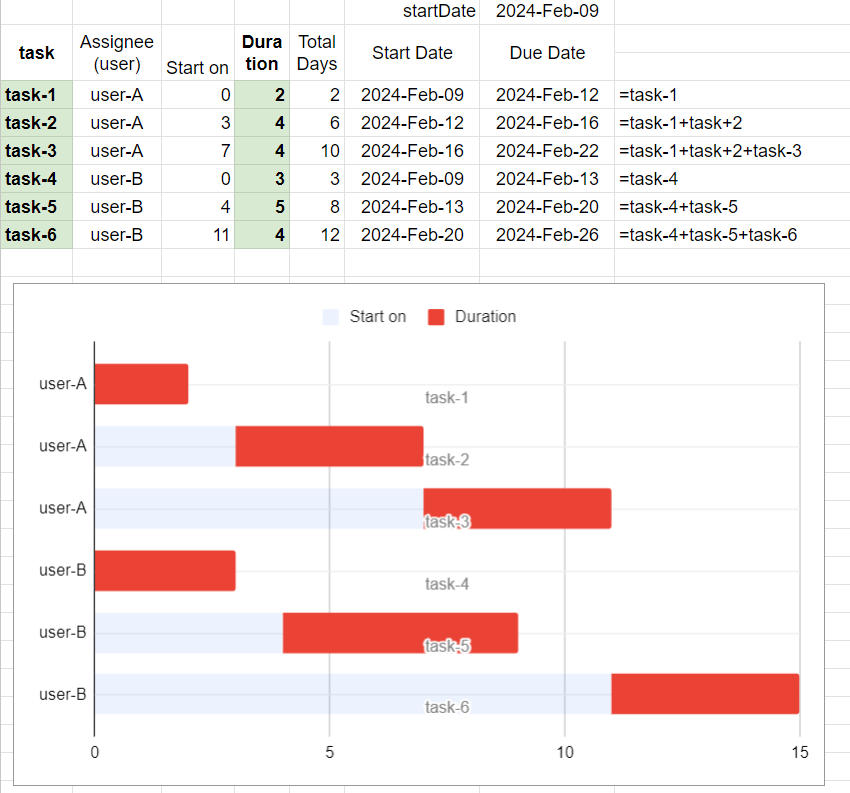
Here's a very simplified preview of what I mean, made in google sheets:
https://docs.google.com/spreadsheets/d/1SCWbiiPwCfpwmBvo8wJsT-9M0cQDVkwSYUvJg4T-0hQ/edit?usp=sharing
First image: You can change the "duration" (in green) and it will automatically calculate the dates based on that.
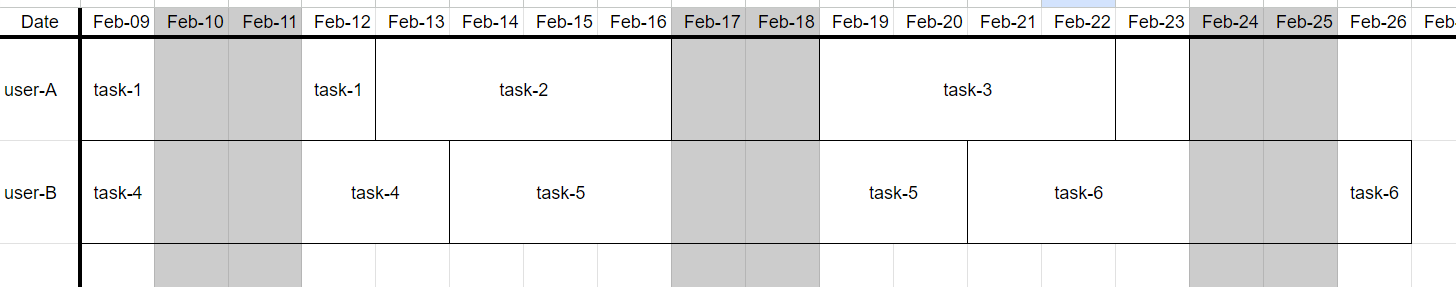
Second image: This shows how I'd like to see this on the calendar.
Because GANT charts are about resource allocation, and once I said a task takes 3 days and is assigned to "Joe", I shouldn't have to do any manual actions anymore. The system knows the task is assigned to Joe, knows it is the 3rd task in his list, so it knows when the stat/end date should be.
And of course: if I reorder the tasks, or change the duration, it should update the gant chart.
Does any of this make sense to you? Not easy to explain :)
Narek Zograbian
fairtale I think this would be a separate view if we were to build this feature. This is more about resource allocation—similar to Asana's Workload feature.
John at Taskade
neekubee Exciting update: Taskade's Gantt Chart View is finally here and ready for beta testing! Seamlessly transition from Mind Map to Table to Gantt and enhance your project planning like never before. We're eager to see you dive in and help us perfect this new feature. Your feedback is crucial and greatly appreciated!

John at Taskade
fairtale Exciting update: Taskade's Gantt Chart View is finally here and ready for beta testing! Seamlessly transition from Mind Map to Table to Gantt and enhance your project planning like never before. We're eager to see you dive in and help us perfect this new feature. Your feedback is crucial and greatly appreciated!

John at Taskade
planned
janssenmanno
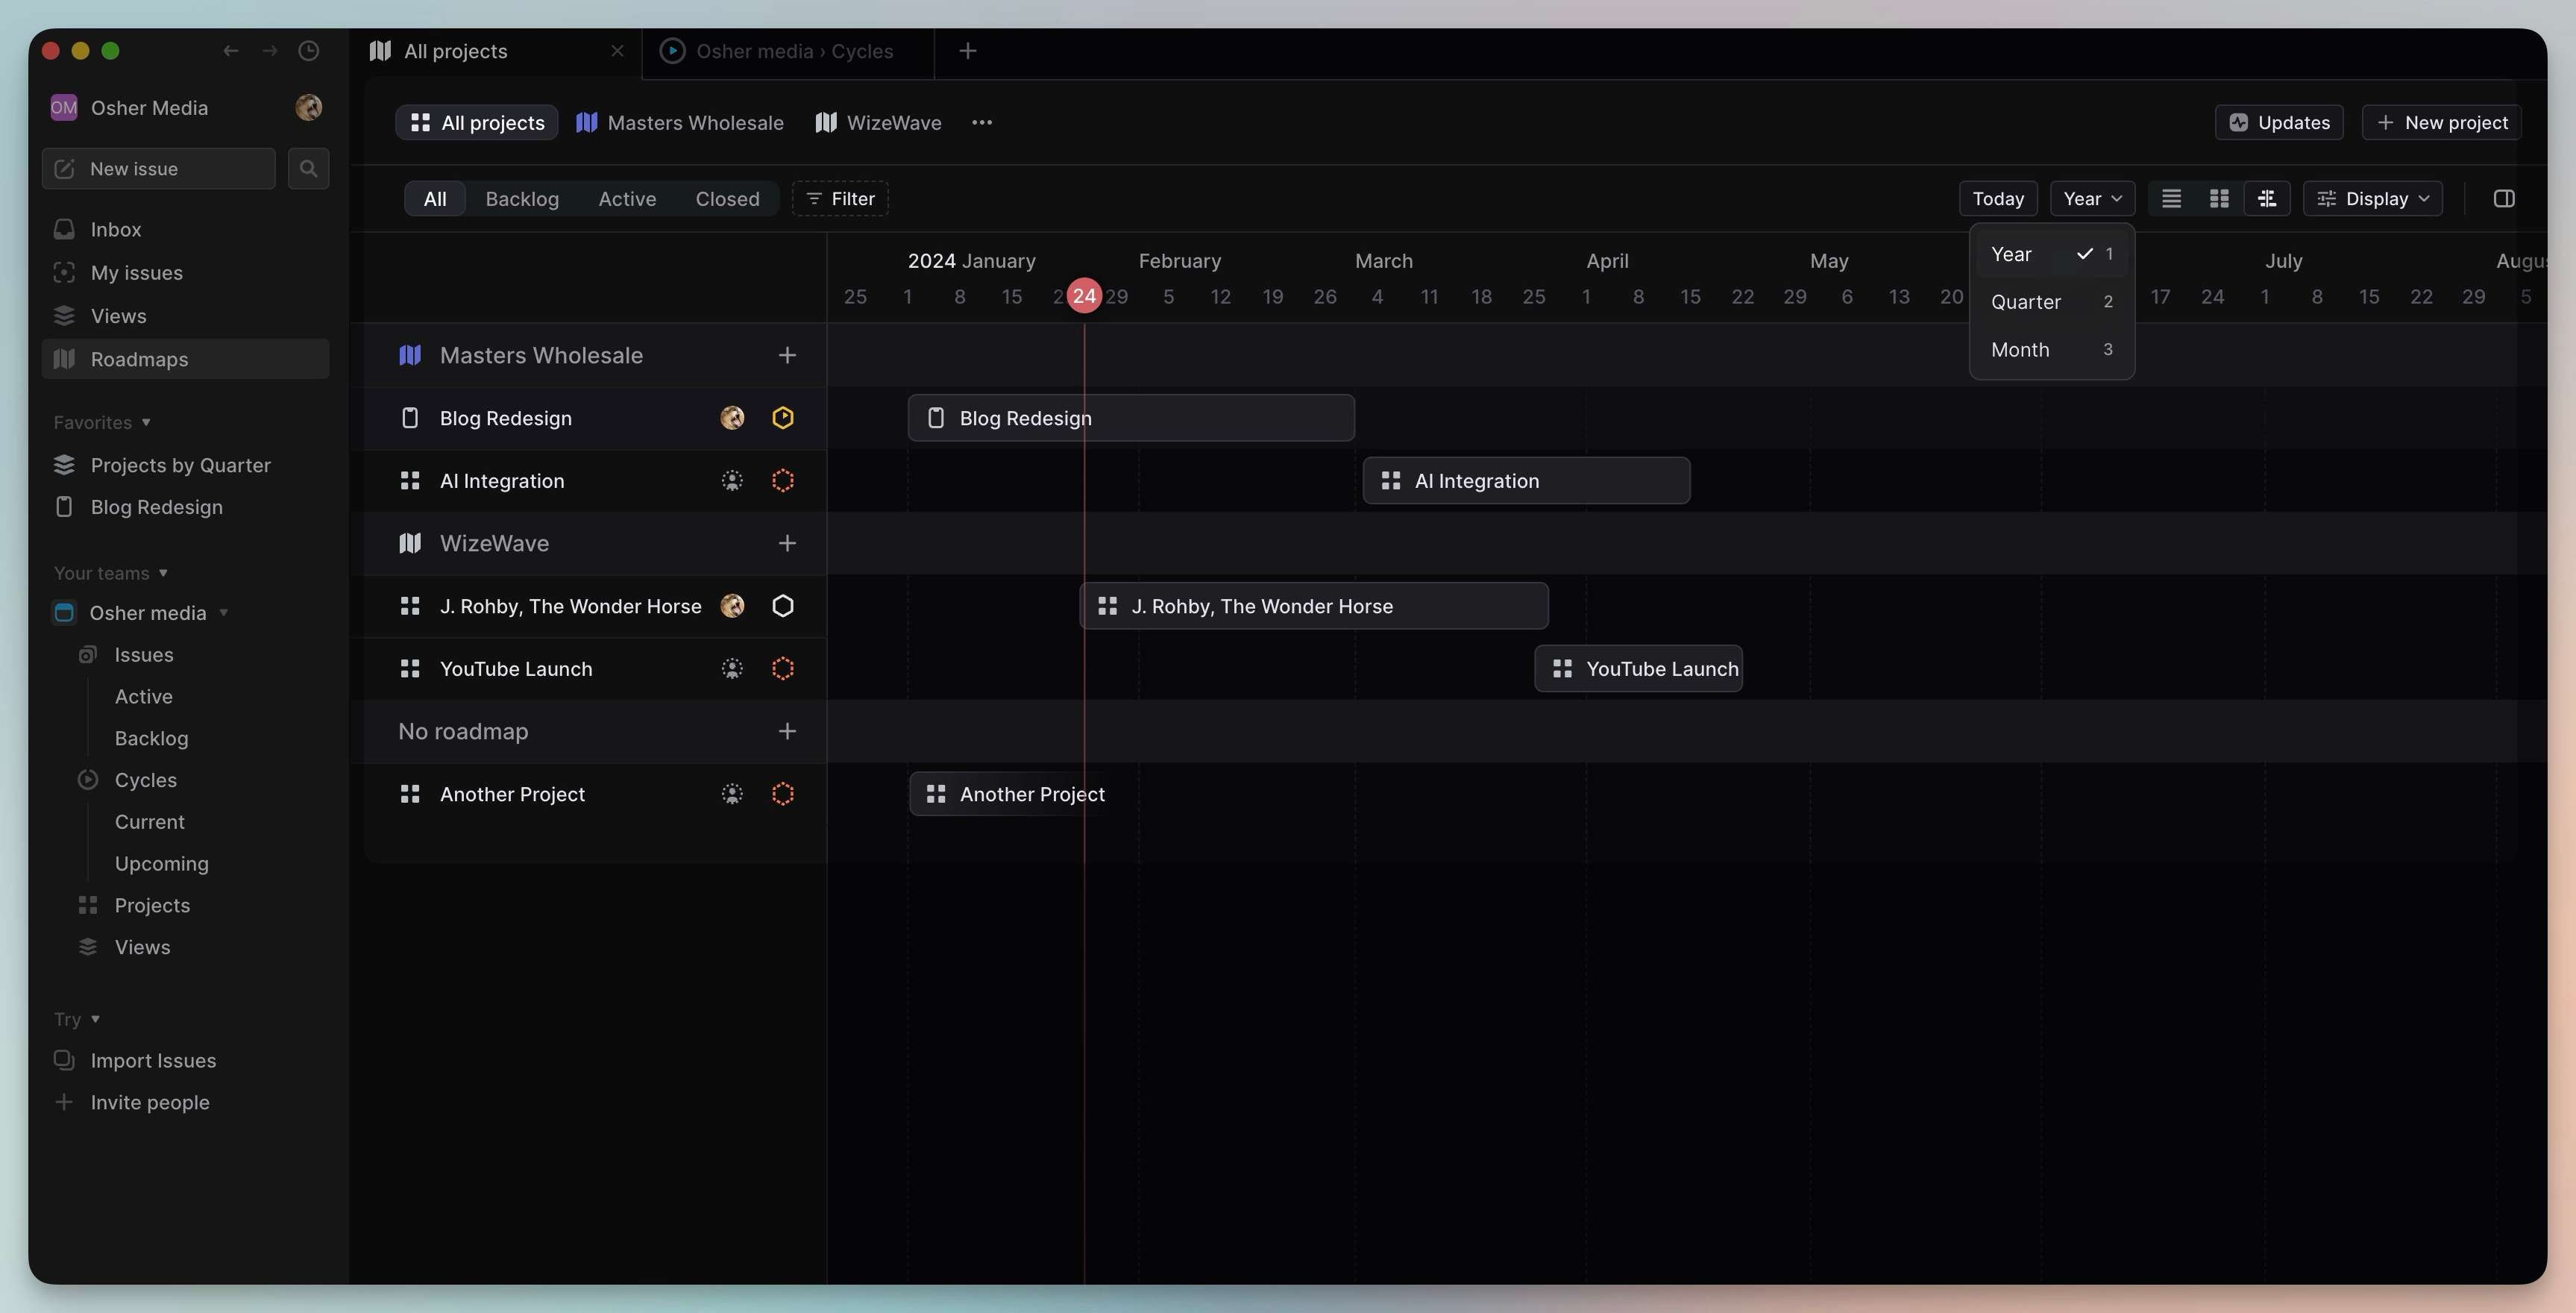
gant chart should have option to view/edit timelines of all projects within a workspace, and also include a yearly view 🙏
John at Taskade
janssenmanno: Thank you, this is a work in progress, see attached.
John at Taskade
janssenmanno Exciting update: Taskade's Gantt Chart View is finally here and ready for beta testing! Seamlessly transition from Mind Map to Table to Gantt and enhance your project planning like never before. We're eager to see you dive in and help us perfect this new feature. Your feedback is crucial and greatly appreciated!
John at Taskade
in progress
Gantt Chart is coming soon at Taskade! 🚀 Stay tuned for this exciting feature that will allow you to view tasks as a Gantt chart, and plan your projects more efficiently. Here's a small preview of what's to come. We can't wait to bring this to you!
garrick
John at Taskade: Where is the yearly view¿? OMG really??? what a mess!!!
J
Jack S.
🤔
More screenshots...
georgia.king
John at Taskade: This looks very flexible, very promising, in the direction I was describing and hoping for.
The line items appear rather tall at the moment, so some kind of spacing option (comfortable/regular/compact) would be helpful.
Being able to pick colors for each little block in the timeline would be helpful too.
May need ability to have multiple blocks in a single row that are overlapping in time.
georgia.king
In regards to "ability to have multiple blocks in a single row" I think the fact that the sidebar allows parent/child nesting... that actually can suffice. I can just put like 4 child items under a parent and give each child item blocks in the timeline. So that solves it, as long as we can get "compact" view to be VERY compact.
Narek Zograbian
garrick: Hey there! Could you provide an example of a yearly view? Examples of other implementations help the team understand the requirements and how to meet them.
Narek Zograbian
georgia.king: In the prototype above, we'd have the option to drag the sidebar to either completely collapse the tasks on the side or to expand the timeline.
However, these are works in progress. Thank you for the feedback!
Narek Zograbian
georgia.king: Would you want a child task to inherit the color attached to a parent task? Or would you want every task to have it's own separate color?
georgia.king
Narek Zograbian: Regarding your comment:
> "In the prototype above, we'd have the option to drag the sidebar to either completely collapse the tasks on the side or to expand the timeline."
That sounds great, and very helpful for making sure we can include as much as possible in the horizontal width of our screens.
That said, my comment when I said this:
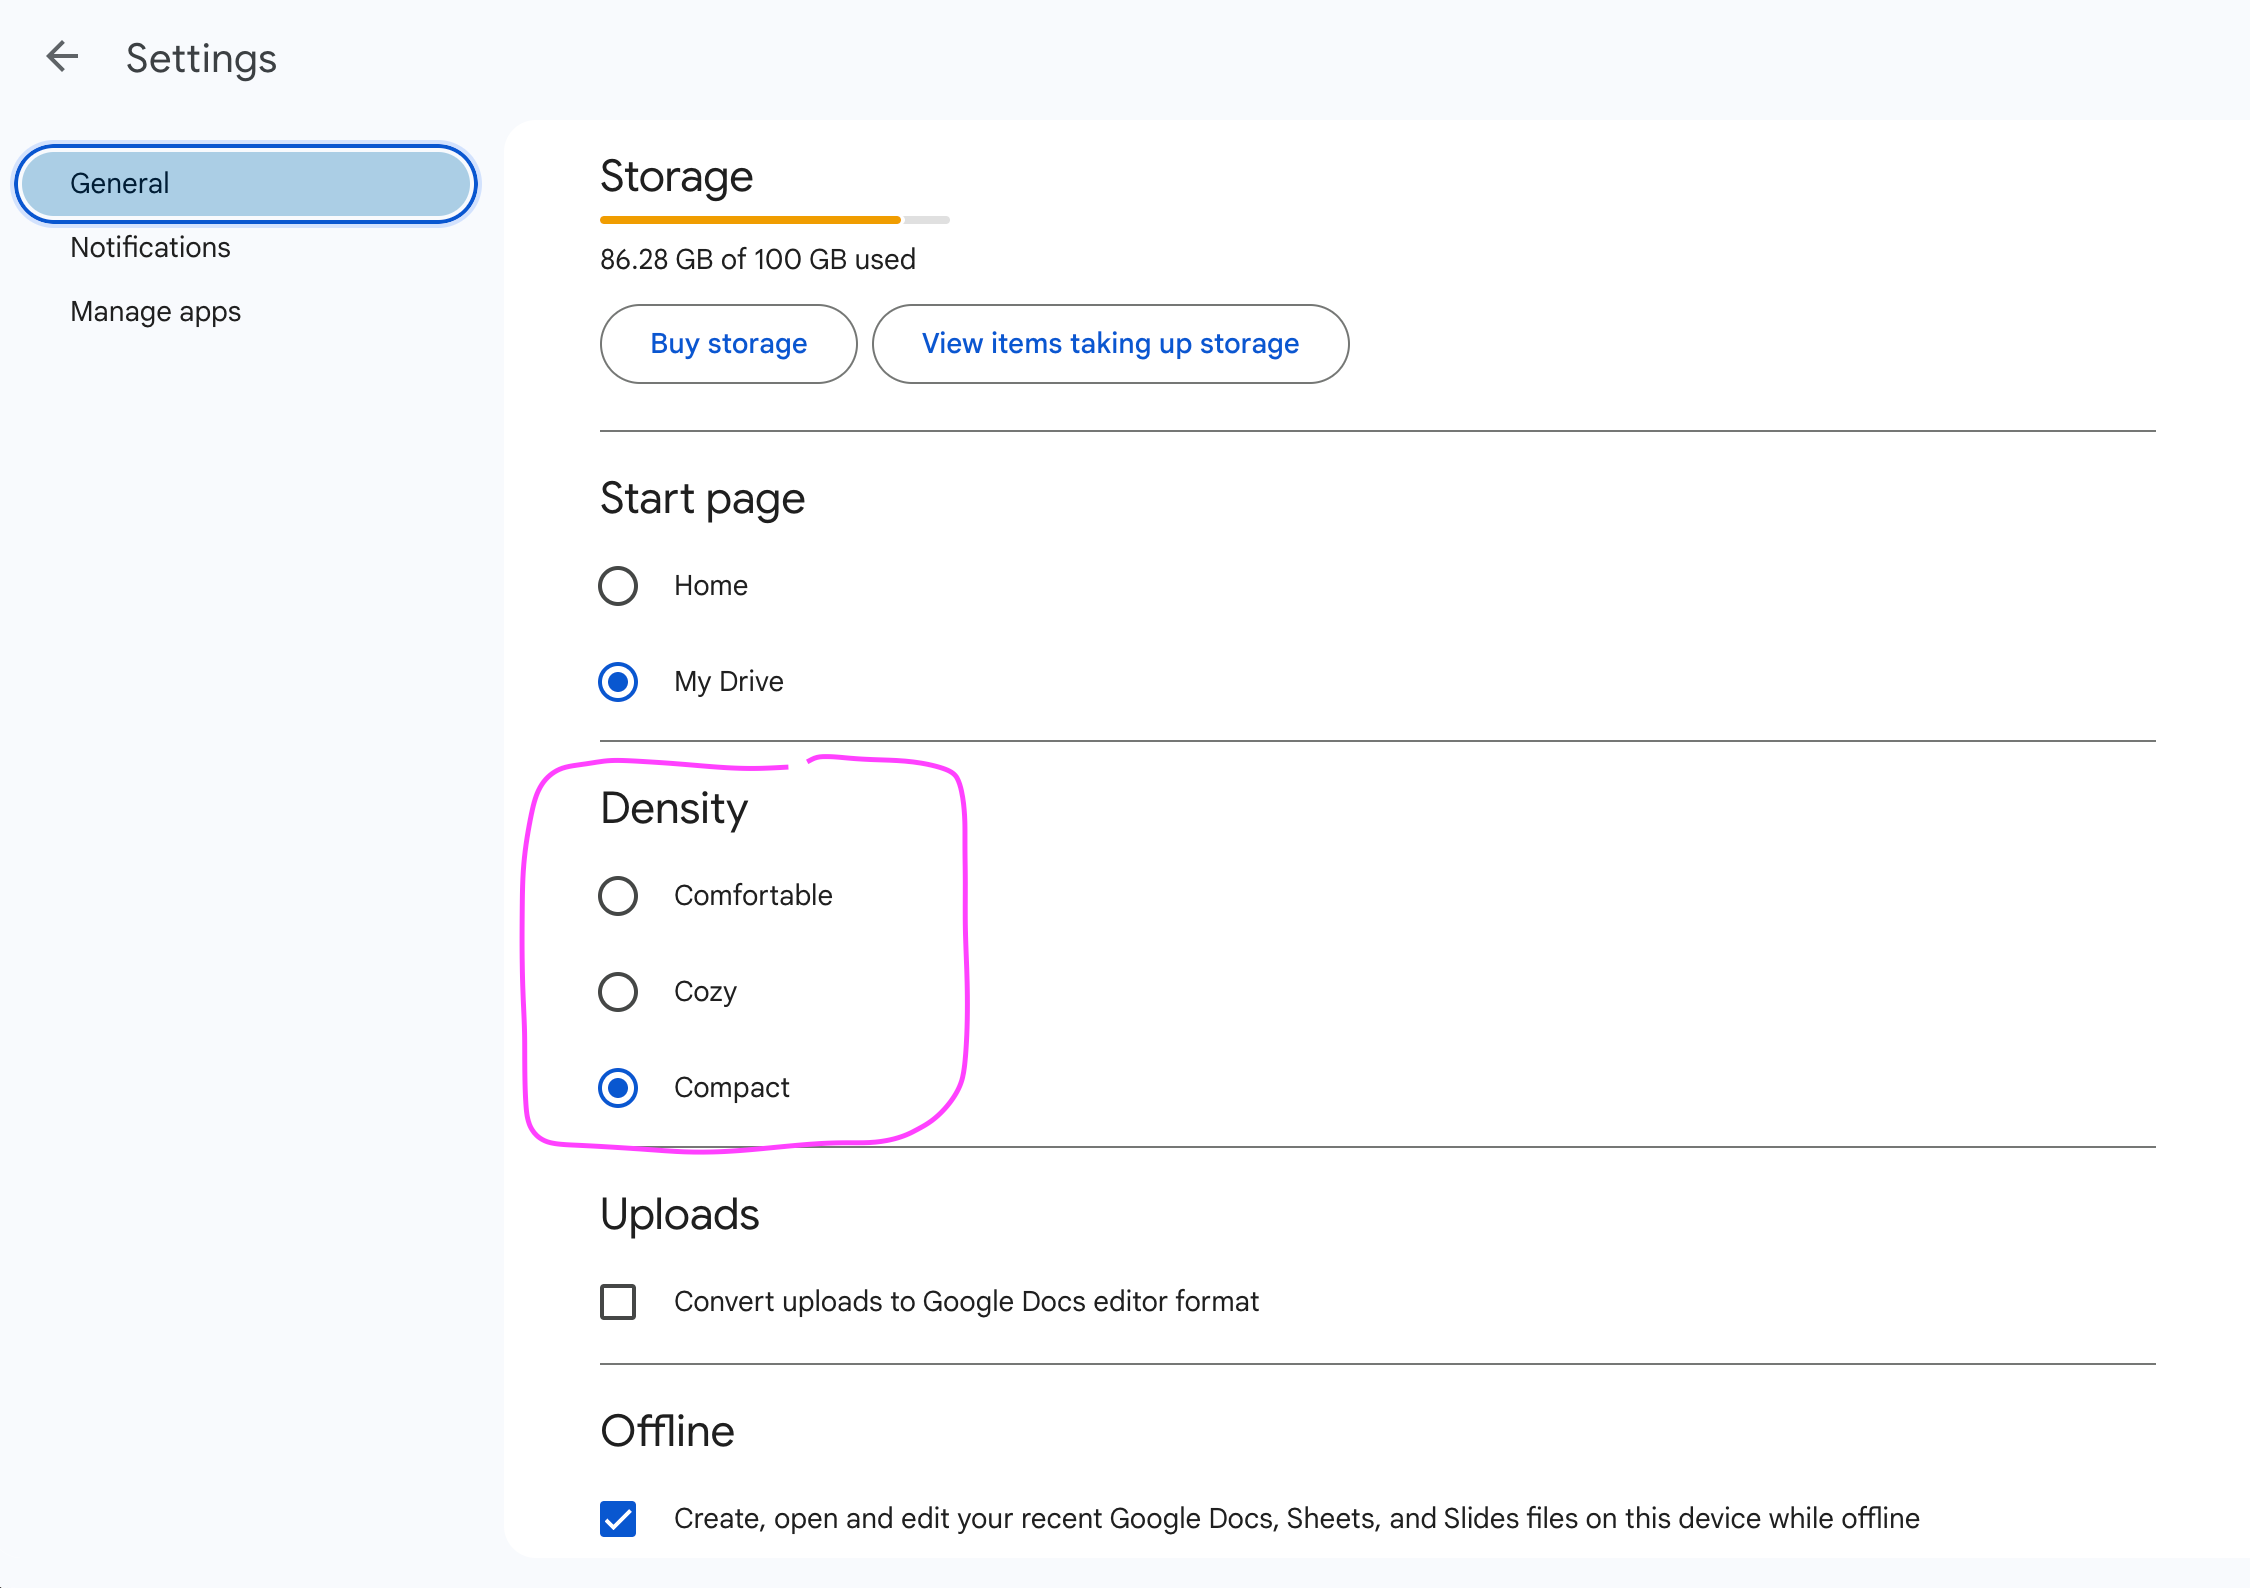
>The line items appear rather tall at the moment, so some kind of spacing option (comfortable/regular/compact) would be helpful.
Is about the vertical height of every line item. Just to be clear. So if you go on google drive, in the settings, you should be able to see the functionality I'm talking about. They call it "Density" and have three options. (See my screenshot.)
georgia.king
Narek Zograbian: Regarding your comment:
> "Would you want a child task to inherit the color attached to a parent task? Or would you want every task to have it's own separate color?"
I would prefer every task to have its own separate color.
Example 1: Resource Allocation
- The left side would have a list of people as parent items.
- The child items would be projects and tasks.
- The bars would be spans of time that those people are working on those things.
- The colors would represent which client the projects or tasks are for.
Example 2: Project Planning
- The left side would have a list of project tasks, perhaps nested under project phases using the parent/child relationships.
- The bars would represent spans of time that those tasks have to be worked on.
- Colors could represent the discpline/role of who is needed in order to work on it, or could represent individual people. Colors could also be used to represent project phases, if tasks are not grouped/nested under parent items representing the phase.
As I've mentioned in previous comments, the #1 priority for me in finding a truly useful gantt chart tool is flexibility. If this thing is constraining in any way, I would just be stuck going back to my old google sheet, which can get messy, but still allows me total control to shuffle things around efficiently.
janssenmanno
Narek Zograbian: see https://linear.app/ for inspiration — lets you see/edit gantcharts across all projects, also lets you use filters to customize groupings. notion also executes this well imo: https://www.notion.so/help/guides/timeline-view-unlocks-high-output-planning-for-your-team John at Taskade
Narek Zograbian
janssenmanno: Hmm. We have something similar called Roadmap in each folder and workspace.
Are you asking for something specific to the workspaces and folders?
This Gantt View feature is for projects only.
Narek Zograbian
georgia.king We actually added that functionality because of your feedback. Thank you!
Narek Zograbian
georgia.king I think based on the feature previews I've listed, the feature should be what you're looking for. The only thing we're missing is colors for tasks. We can look into that feature even more.
fairtale
janssenmanno that looks really nice and clean! would be nice to have users/teams on the left instead of task-groups
John at Taskade
georgia.king: Thanks Georgia, here is a deeper dive and preview https://help.taskade.com/en/articles/9072639-gantt-chart-view
Would love your thoughts and feedback! CC Dionis Loire Narek Zograbian
georgia.king
John at Taskade I see that article but I'm not seeing the icon to switch and look at the gantt view, when I'm viewing the app.
Narek Zograbian
georgia.king We haven't released it yet. We're estimating around 2 weeks from now.
georgia.king
Narek Zograbian I see the icon now, but it's telling me to upgrade. Am I not allowed in the beta without paying?
Narek Zograbian
georgia.king: This is a premium feature that's paywalled.
kbade
suggest within the Action view since start/end date & assignment etc info already present
Narek Zograbian
kbade: Hey there! The way we would most likely support this is a list of tasks on the left-hand side.
You'll then be able to drag the tasks across a timeline to set the date like our Roadmap view in the Workspace/Folder level.
You'd also be able to assign users to these tasks from this view as well.
Are there any features that you think are missing?
John at Taskade
kbade: We will continue to improve the Action View!
John at Taskade
kbade Exciting update: Taskade's Gantt Chart View is finally here and ready for beta testing! Seamlessly transition from Mind Map to Table to Gantt and enhance your project planning like never before. We're eager to see you dive in and help us perfect this new feature. Your feedback is crucial and greatly appreciated!
georgia.king
Gantt charts in taskade would be EXTREMELY useful if it could be as fast and "free form" as the board view currently is. I use taskade because it's less rigidly structured than other tools. Smartsheet used to be pretty good for making a fast gantt chart without entering a ton of structured data for every line item. But it seems to have changed a lot over the years, and last I checked, I'm not able to see what it's like without jumping through account creation / payment hoops.
Narek Zograbian
georgia.king: Do you have any specific features or ideas that you'd like to see in a Gantt Chart view?
georgia.king
Narek Zograbian: I imagine it as one column on the left, which acts pretty similar to a single column of the "Board" view. You just list items, nest them, collapse or expand them. But then what's special about it is there's also a timeline across the top, and each item in the left column has a row that goes across the whole screen. You could click somewhere on the timeline in a row, and it would start a colored block, you hold down and drag and drop... when you let go, that's where the block ends. So it would feel like you're just drawing a line with your mouse to set the start and end dates. The timeline could be a "snap to grid" so where ever you click, it just rounds to the nearest line in the grid (day, week, hour, whatever).
The timeline would be something you could zoom in and out, so you could make a months-long forecast, or zoom all the way in to a day and block out like 15 minute increments if you want. Each of the bars/blocks that you draw could have a little icon when you hover, and if you click it, you can change its color, manually declare the dates/times, or whatever else. One thing could be an icon that lets you drag and drop to define a dependency connection between blocks. Then when you move them along the timeline, they all move together.
The hardest thing that I don't have a solution for without thinking deeper is if there was some way to swap between a view of projects/tasks in the left column, vs. assignees in the left column. So you could use it for resource allocations within a team, or you could use it for defining project timeline/milestones.
The number one thing to avoid is forcing us to define tons of parameters about each item, in order for it to appear on the gantt chart, and appear properly. Other project management software makes you create a client, then create a project, then create a task, then give the task dates, then define dependencies with another task that you also had to create with a lot of fields to fill in... its just massively tedious. I'm looking for a tool that lets me draw a picture super fast. Right now I just use a google sheet and put color fill in the cells and a quick label in a cell to remind me what the block of color represents.
J
Jack S.
👍
Narek Zograbian
georgia.king: This was a pretty in-depth look at the Gantt chart. Have you checked out the "Roadmap" feature in the Workspace?
I'm assuming you're referencing something similar to that?
Regarding dependencies, we have another request that's related to this. I'd love to get your input on that one and how you see dependencies implemented in other project views, too.
Do you have any apps that you think have a good implementation of Gantt chart?
georgia.king
Narek Zograbian:
Yes that workspace-level roadmap thing would be a great place to start.
- The zoom functionality is awesome. I'd probably use it most often at the level where it's as tightly packed as possible while still having every day's date number visible.
- But the names of projects are not visible at all zoom levels. Maybe that's not something which needs changing, since they are visible on hover.
- Not sure if there's a way to show a duration as opposed to a single due date.
- Seems only at project level, not individual tasks within projects.
I wrote some thoughts on the dependencies page that you linked to.
Unfortunately I don't have any apps that I would recommend or consider good implementations of Gantt chart, because they all have this same problem of "too much data entry". And maybe I already said this above, but I'm too lazy/busy to re-read my own huge comments: but the reason I use Taskade is because I don't have to do anything special to just type a list as if I'm typing in a word doc, and I still get all the board/column/accordion functionality to make managing my lists efficient and practical. I haven't looked in a long time for other Gantt options because I'm too busy and I'm just using that spreadsheet method I think I probably did mention. It's messy but it's fast and totally customizable with no extra data entry.
Narek Zograbian
georgia.king: Duration is another struggle. The main problem is that Tasks have three time-related functions:
- Start Time: The time when a task is set to begin.
- End Time: The time when a task is expected to be completed.
- Duration: The total amount of time taken from the start to the end of the task.
How would you suggest tackling this issue while maintaining simplicity?
J
Jack S.
👍
georgia.king
Narek Zograbian: If you're just talking about the amount of calendar time between start and end, it's really not an issue. It's just a calculation. You can allow people to edit those things in the same way that a graphics program allows someone to edit rounded corners, or the size of an image - there's a little lock icon and it toggles whether all corners get the same rounded-ness or whether you want to have different rounding on each corner. Or it toggles whether you want to maintain aspect ratio or just stretch the image. Well, probably you would never want to break the rules of time itself, so you wouldn't need a toggle, you'd just need to have the three fields operate as if they are always in the tied-together mode.
Now, if you are talking about the fact that start and end time on a calendar can differ completely independently of the number of man-hours it takes to complete a task (duration), then you have a much more complex problem. In that case, I would say only use the start and end calendar times for gantt chart creation and editing by humans. Use the duration (estimated man hours to complete the task) as a guide/input when an algorithm or AI is auto-generating a gantt chart from some list of tasks whose start and end dates are not yet defined.
Narek Zograbian
georgia.king: Ok that makes sense. Project views use the same data and only manipulate the way its presented. So I think for Gantt Chart, the main question is this: When you're editing the time for a task on a Gantt Chart, are you editing the dates when the task is due, or are you editing the time that it takes for the task to be completed?
The way we approach and handle this feature depends on your answer. If it's duration, we'll need to build that functionality. If it's simply calendar dates, we can use the Due Date functionality to accommodate it.
John at Taskade
georgia.king: Just posted an update here! Stay tuned and check out https://www.taskade.com/blog/updates/ on our latest.
georgia.king
Narek Zograbian: Sorry I didn't respond sooner. Life is crazy. The update above from John looks like a good direction so far!
Narek Zograbian
georgia.king: Not a problem at all! I appreciate all the feedback you've provided us!
John at Taskade
Hi georgia.king — Exciting update: Taskade's Gantt Chart View is finally here and ready for beta testing! Seamlessly transition from Mind Map to Table to Gantt and enhance your project planning like never before. We're eager to see you dive in and help us perfect this new feature. Your feedback is crucial and greatly appreciated!
infinitestair
This all we need to have a perfect project software. DEPENDANCIES and Gantt
John at Taskade
infinitestairExciting update: Taskade's Gantt Chart View is finally here and ready for beta testing! Seamlessly transition from Mind Map to Table to Gantt and enhance your project planning like never before. We're eager to see you dive in and help us perfect this new feature. Your feedback is crucial and greatly appreciated!
Load More
→